Service
Analytics and Visualization Applications

In today’s data-driven world, having the tools to leverage vast quantities of information to make smarter decisions has never been so important. Quoin has the real-world experience to apply these practices so that your organization too can harness and translate ‘Big Data’ into meaningful insights. From architecture to implementation, we excel at building systems that support the aggregation, analysis, and visualization of data that drive informed action.
Our technologists have delivered sophisticated analytics applications in media, publishing, media monitoring, retail, health insurance, and other sectors
Our engineering know-how enables Quoin to select the technologies and design a solution that is right for a particular client and project
We thrive on problem-solving and technical challenges such as aggregation, statistical analysis, machine learning, and visualization
Quoin has built applications that can sift through staggering amounts of data and identify patterns for predicting viral content, recognizing fraudulent transactions, and more
QUOIN understands that there is no one-size-fits-all solution for data analytics and visualization. Organizations with large, diverse sources of data often require custom back-end solutions, employing Big Data technologies and advanced machine learning techniques to process and transform data in an adaptive manner.
That said, we base many of our client projects on a proven architecture for big data, as illustrated in the generalized reference image below. This architecture consists of core data management, content/data sources, and end-user applications that access the analytics. We discuss these three components in more detail in the following sections.
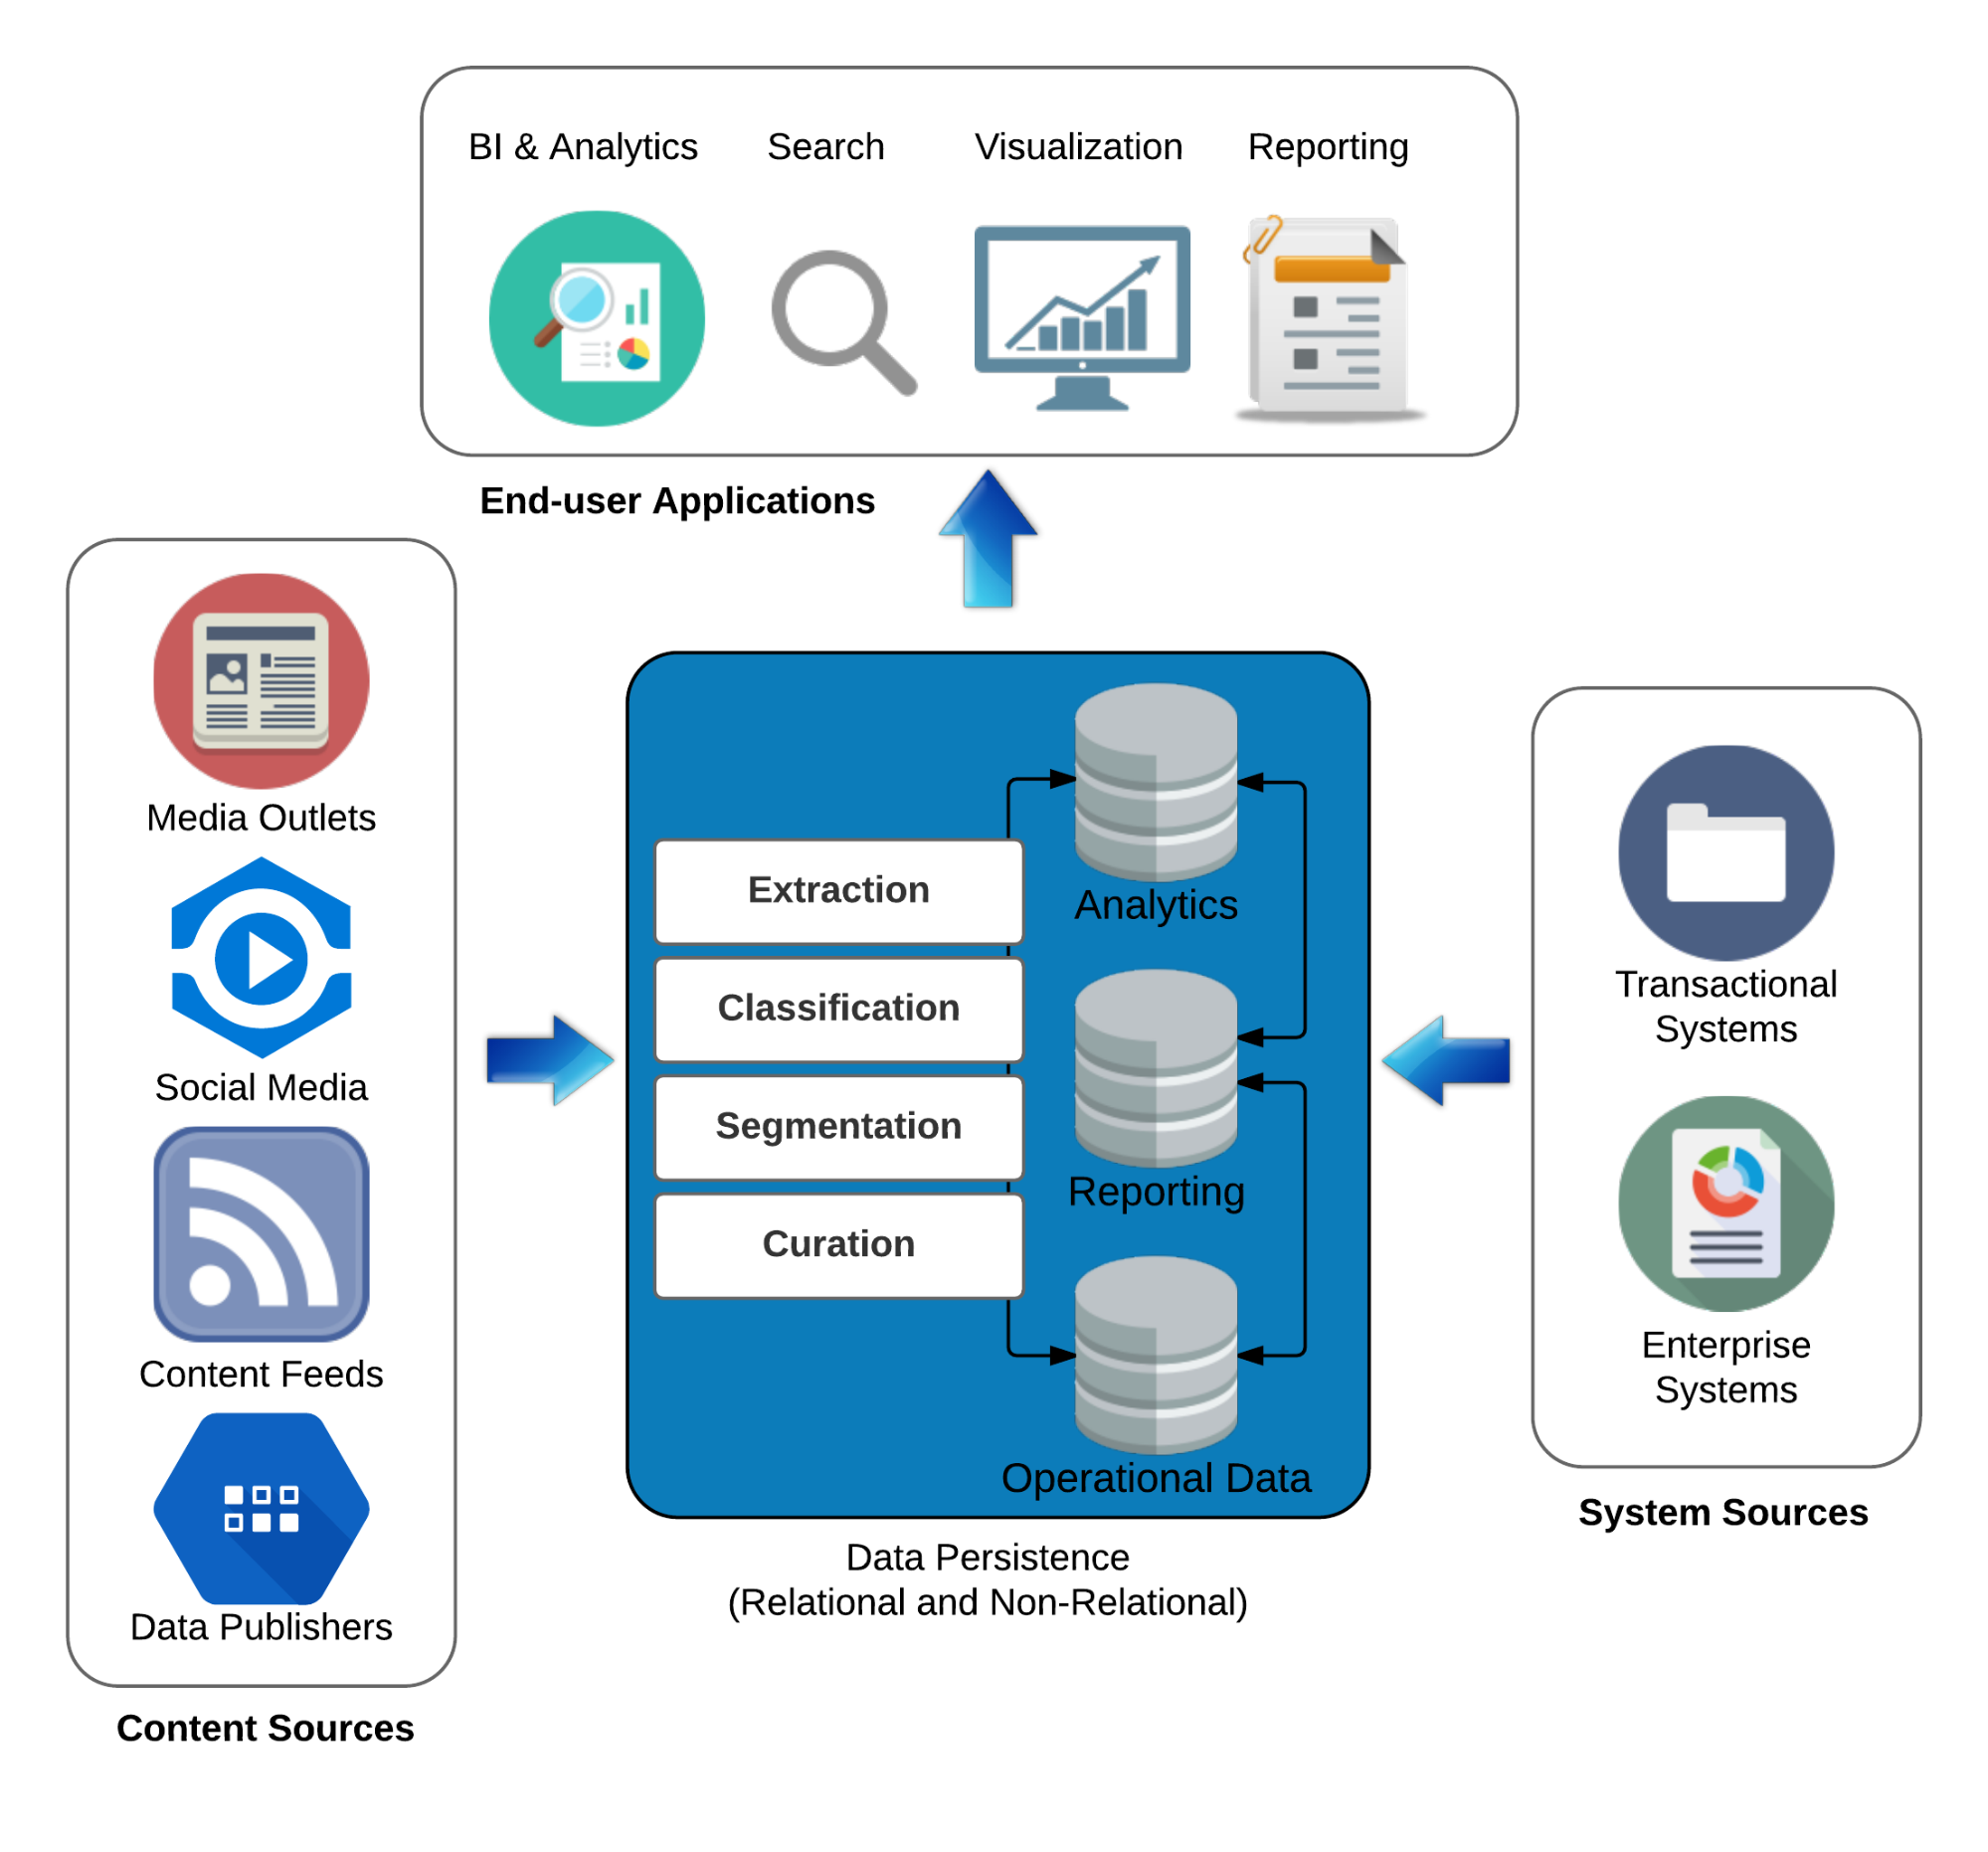
Enterprise systems typically include operational, reporting, and analytics data. Each type of data has specific system dependencies and relevant technologies. Although a big data project would use non-relational data stores such as Hadoop, operational and reporting databases will often use conventional, relational technologies. This hybrid of relational and non-relational technologies is required to support both legacy systems and disparate types of data.
Content and data sources could include traditional media outlets, social media platforms (e.g., Twitter), specialized content feeds, and data publishers. System sources are usually external to an organization and its enterprise systems. The data and content is ingested by the system, supported by complex transformation rules and processes. System sources include the range of transactional and other enterprise systems and are typically existing applications built on operational databases.
The aggregated content is then subject to analysis, using one or more techniques, categorized as:
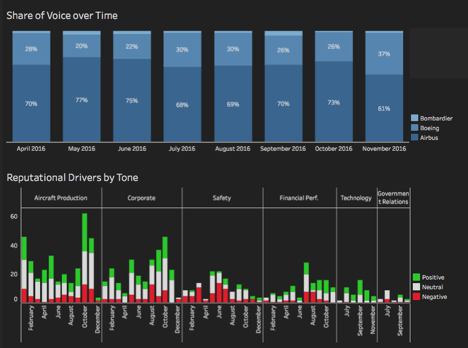
This figure displays a visualization for the Share of Voice over Time metric for an aircraft manufacturer (i.e. the number of times this manufacturer is mentioned in news articles, blogs, social media posts, and other online content versus its competitors). The time-series graphic shows both Share of Voice and key topics, or ‘Reputational Drivers’ with a positive, neutral, or negative tone.
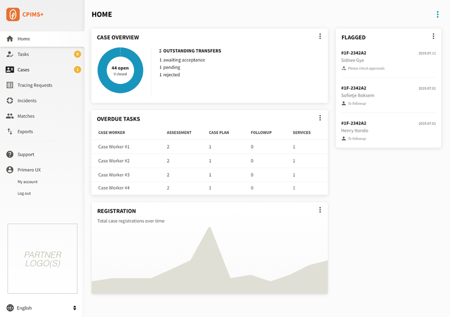
As a case management platform, Primero tracks a number of important metrics – date opened, resolution, date closed, caseload, and others. These metrics help to inform and improve the delivery of services to at-risk children and their families. In this image, we show the main dashboard for a case manager.
Designing an application to analyze information and visualize insights from multiple large, heterogeneous datasets involves a number of challenges.
Turning data into actionable insights requires a cogent presentation. Quoin leverages our extensive experience designing and implementing data visualizations (graphs, maps, etc.) that are attractive, accurate, and meaningful to an end-user
Quoin uses a number of JavaScript-based frameworks to build rich, immersive analytics interfaces. In particular, our developers have extensive experience using Angular JS and the React/Redux front-end stack. Both these frameworks render the UI on the user’s browser rather than the back end, meaning that increased site usage has minimum impact on server load.
These front-end frameworks facilitate highly responsive and dynamic pages which allow the user to explore new information and aspects of the site without page reloads and with minimum time lost to server responses. In combination with the above frameworks, our designers and engineers have employed a number of open source libraries for creating clean, dynamic analytics interfaces: